Color Gradient Techniques
We all know what a color gradient looks like. Just two colors on ends of some object (or more) with colors filled in between. If you’ve dealt with them enough, some color gradients, such as below created in Inkscape, will cause a “grey” area in between, which can be undesirable.
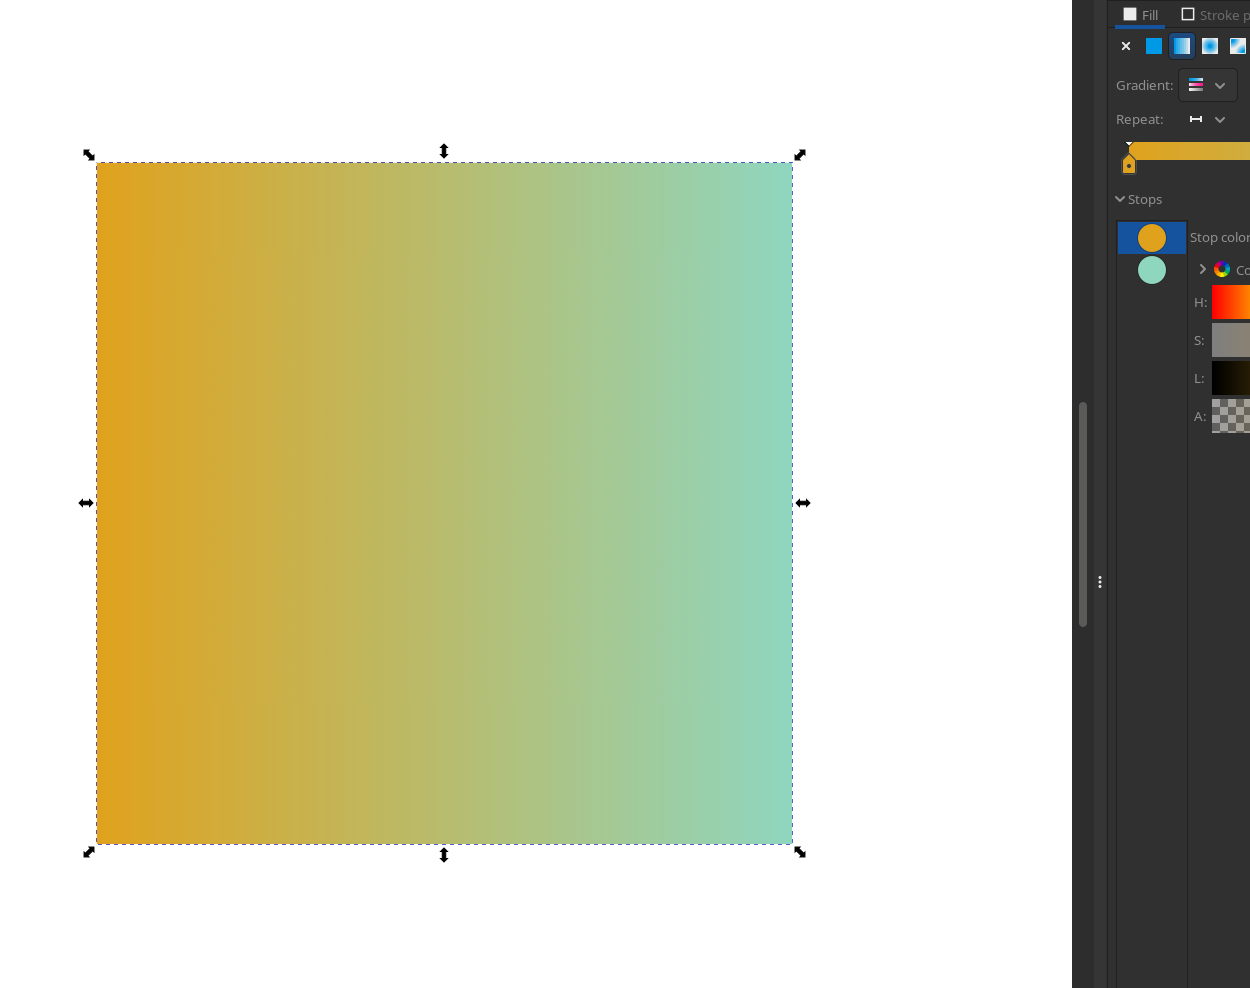
This is generally because the colors are interpolated in the RGB color model.
So I though about experimenting with interpolating in RGB and the HSV color model, and then wanted to experiment with non-linear interpolations. And thus I arrived at this mini-project, where I will be interpolating between two colors in different color models and with different functions.
Background
Color Model/Space
If you aren’t familiar about the different color model, I will quickly try to explain it. You can read more about it on its Wikipedia article1.
A color model is simply how one defines color components and describes all colors numerically. For example if you look at a cyan object, a color model would tell you how to represent that color numerically. The most popular color space you probably heard of is RGB, where all possible colors are split up into the Red-Green-Blue component. This is mainly because of how we perceive colors with our 3 color rods in our eyes, so we designed many systems around this RGB model, such as subpixels of any* color display.
Another useful color model, particularly for design work, is the HSL or HSV color models. These models describe a color based off some “hue” (what color), saturation (how poppy the color is versus grey), and value/lightness (how bright is the color).
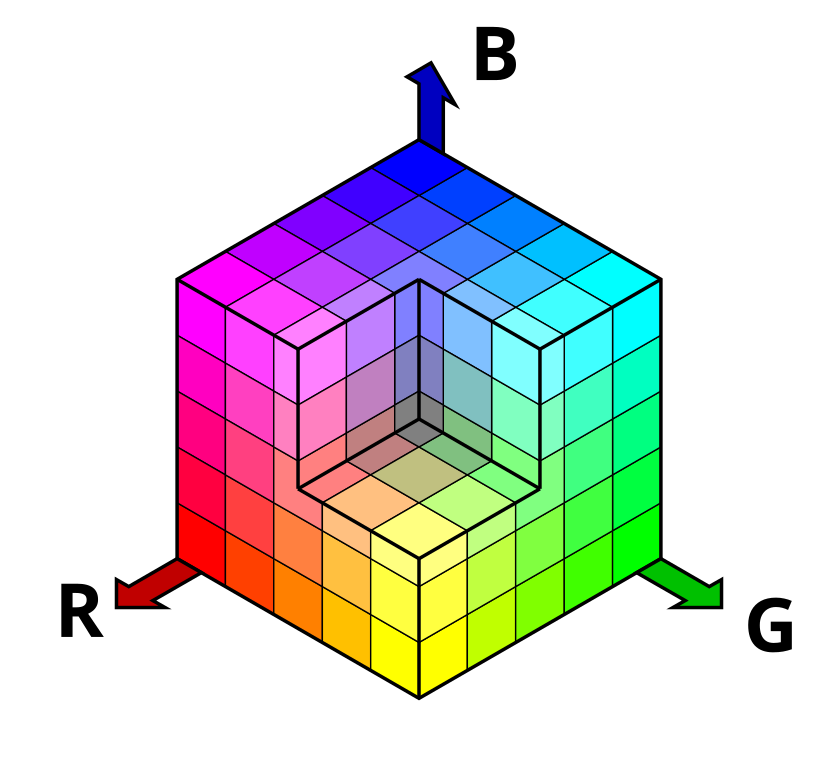
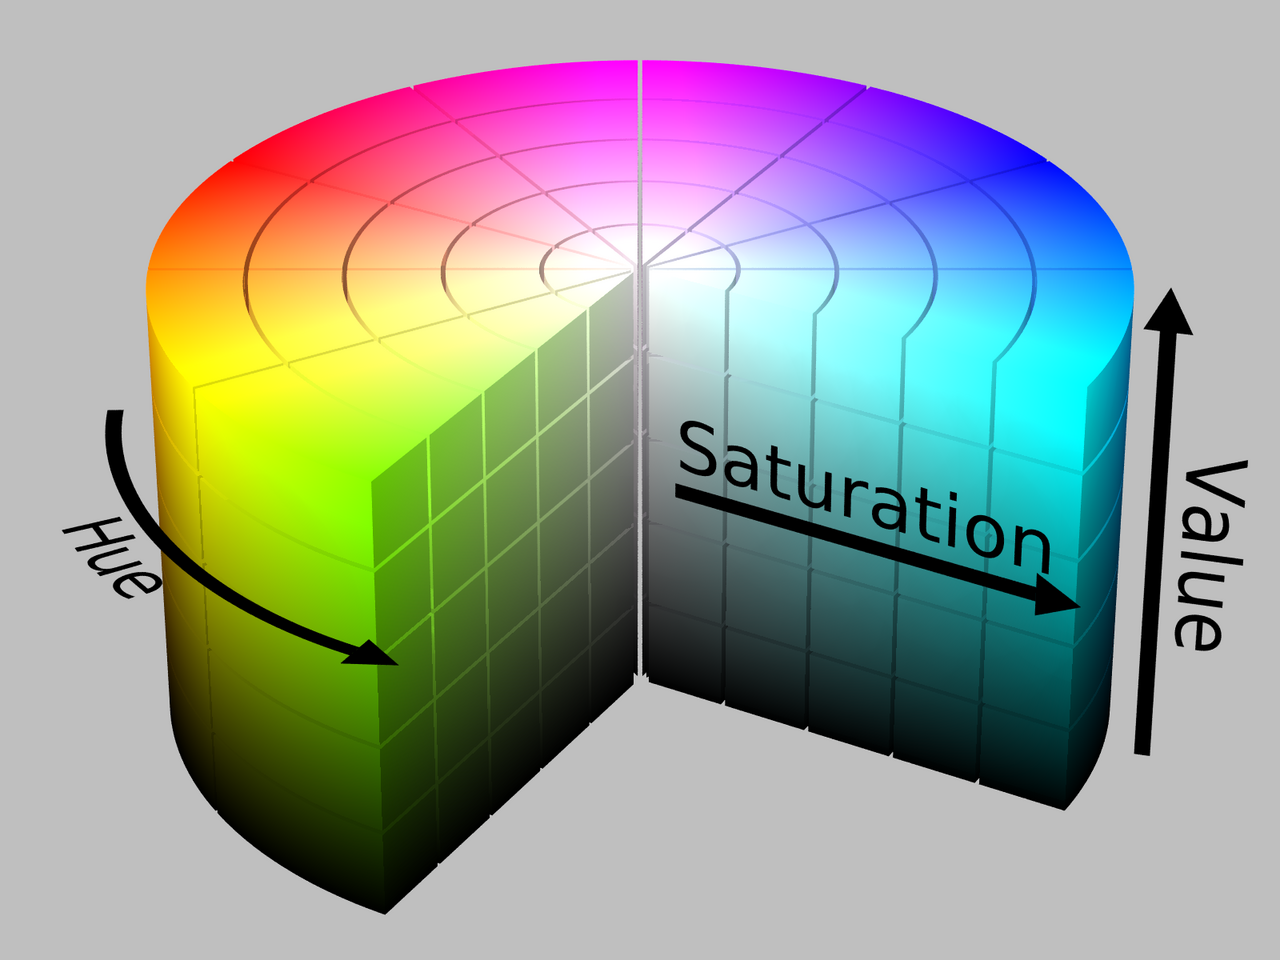
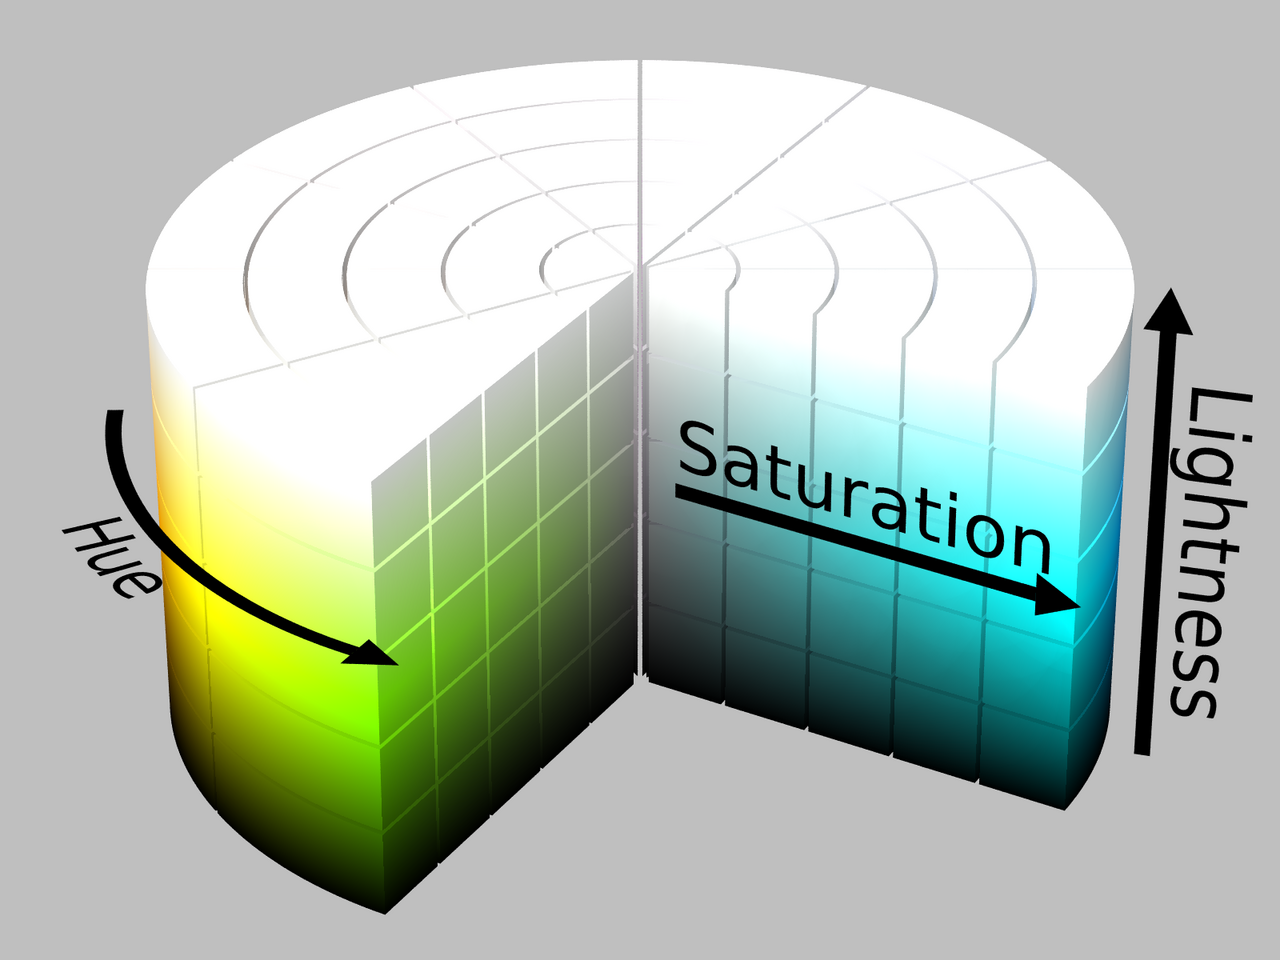
Color Spaces showcase, see 2 for image source
A color space3, which is what you more likely heard of, is simply a set of colors and how they are physically perceived like by the human eye. For example there is sRGB (the common one that you may have heard of), AdobeRGB, REC.709, etc. I sometimes get confused between a color space and color model, and it doesn’t help sometimes a color model (like HSV) is called a “color space”.
Interpolation Function
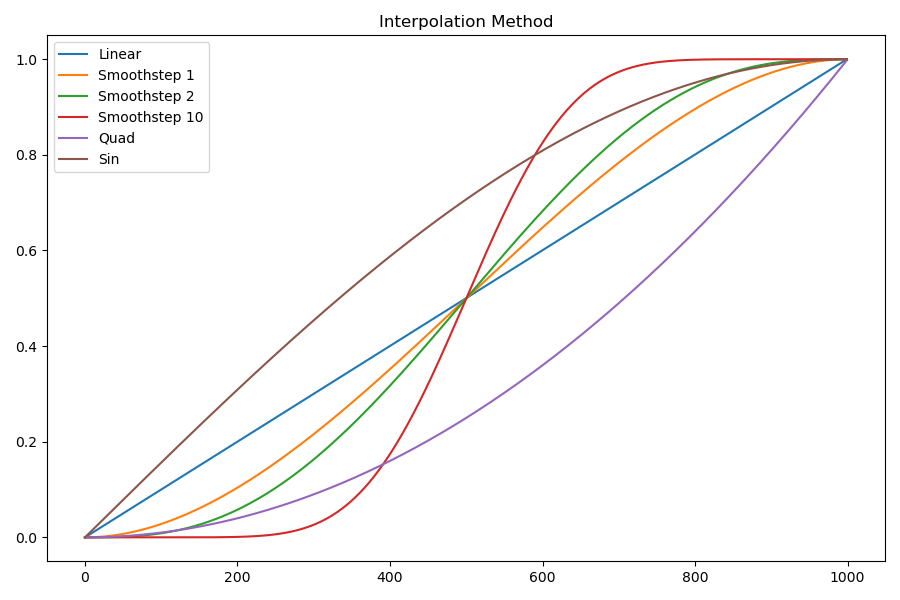
How to get from point A to point B across some axis (for example the gradient width)? While the common and simplest one is a linear function, you can imagine there are in theory infinite functions that can be drawn between point A and point B. I decided to play around with some more functions, including:
- A smoothstep4 function
- A quadratic function
- A sinosoid function
Hue Interpolation
Because the hue specifically is a circular value (from 0 to 1 and back around), I had to modify my interpolation functions so that it will find the shortest interpolation path (stepping positively or negatively) then wrap around 0 and 1. I did it with the following Python code, which, while isn’t the cleanest probably, works including in edge cases.
delta = val[1] - val[0]
if wrapPath and (1 > abs(delta) > 0.5):
    if delta < 0:
        interp *= 1-abs(delta)
    else:
        interp *= delta-1
else:
    interp *= delta
interp += val[0]

# wrap values to between 0 and -1
interp = np.where((interp > 1), interp - 1, interp)
interp = np.where((interp < 0), interp + 1, interp)
Gradient Comparison
What started out as a basic gradient generator with different in-line parameters, quickly spiraled into an application that generates an image comparing multiple color model and interpolation function gradients.
To start with, let’s look at the comparison for colors #e0a21d and #1de0a2.
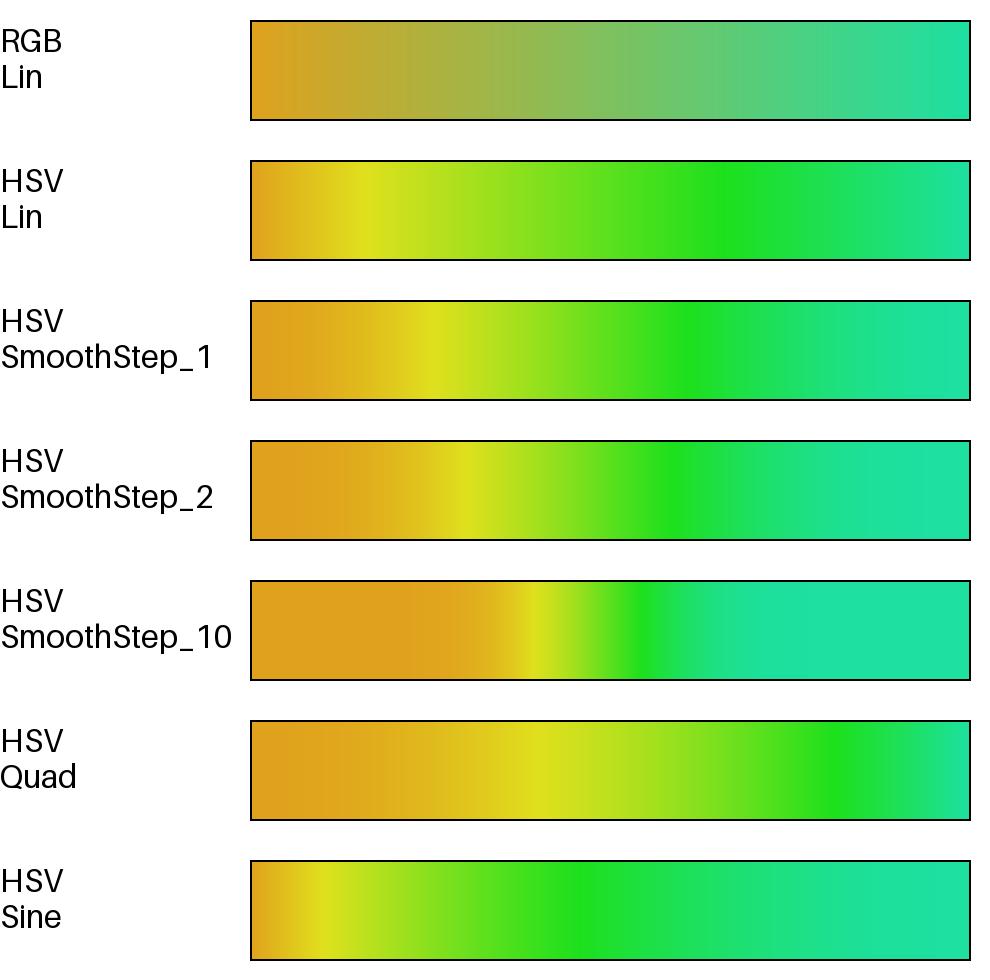
The first RGB linear interpolation leaves some grey-ish desaturated colors in the middle, while switching to the HSV model nicely leaves the colors at a nice saturation/value throughout the gradient. In my opinion, this looks nicer.
As for interpolation functions, the linear is probably what one would normally use. The smoothstep function sort of “compresses” all the changes in the middle, especially as the smoothstep N value is increased. The quad interpolation leaves color changes towards to the end, and sin to the beginning.
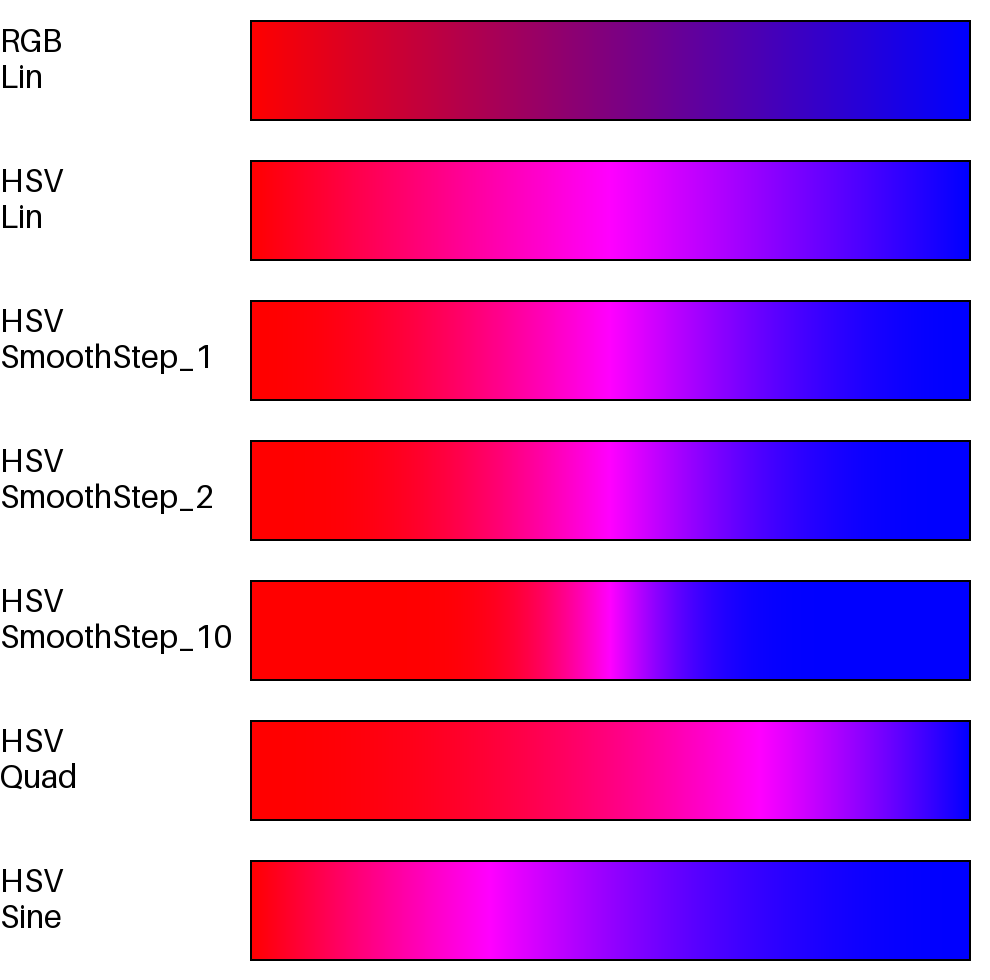
Here is another comparison between pure red and pure blue. The blackening on the gradient in RGB-interpolation is definitely noticeable
Color Model Interpolation
I did play around with interpolating in the RGB, HSV, HSL, and YIQ color models5. I discovered that the RGB and YIQ model interpolations resulted in the same gradient, and so does HSV and HSL. That is why the comparison chart only includes RGB and HSV interpolations.
Animation
I had something going on to play around with gradients, but how about color animations? Of course this small project spiraled again, and now my test script can also generate animations to compare.
I created a different set of interpolation functions that simply loops back to zero
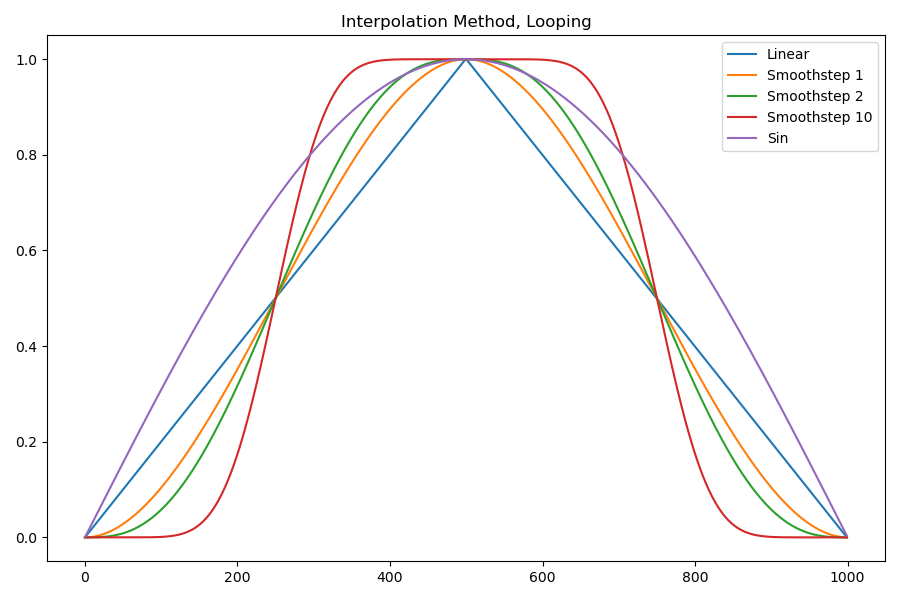
Below is the result of the two color gradients in animation form:
Note sure if this was useful, but pretty neat to look at.
End Note
I put the code I used to generate these gradients and animations on my Github repo
Footnote
-
Color Model, Wikipedia: https://en.wikipedia.org/wiki/Color_model ↩
-
Color Space, Wikipedia: https://en.wikipedia.org/wiki/Color_space ↩
-
Smoothstep, Wikipeia: https://en.wikipedia.org/wiki/Smoothstep. Implementation copied from here ↩
-
For the keen eye, those are the color models available in the built-in Python colorsys package ↩