GOES HRIT Reception First Attempt
Posted 2021-11-25
GOES HRIT
NOAA host several geosynchronous satellites for meteorological and weather purposes. Out of the broadcasts their GOES-R series of satellites beam down, one of them, the HRIT/EMWIN broadcast, sends down reduced resolution of some channels off the satellite’s imager and some text. While limited, this signal can be picked easily with some relativity cheap hardware and decoded with free software.
What is required to pickup the HRIT signal is an SDR (Software Defined Radio), an LNA (Low Noise Amplifier), and a dish antenna that is able to pick up signals in the L band (more specifically around HRIT’s 1694.1 MHz center frequency). Luckily, Nooelec sells a kit specifically made for this purpose that comes with nearly everything required to capture HRIT signals. This is what I purchased, and started playing around with it.
The data and images broadcasted down can be found in NOAA’s site. The imager’s bands, which HRIT includes a limited amount of, are explained here with a guide per band.
There are 2 GOES-R satellites that are currently operational: GOES-16 and GOES-17. GOES-17 covers the west coast, while GOES-16 covers the east coast:
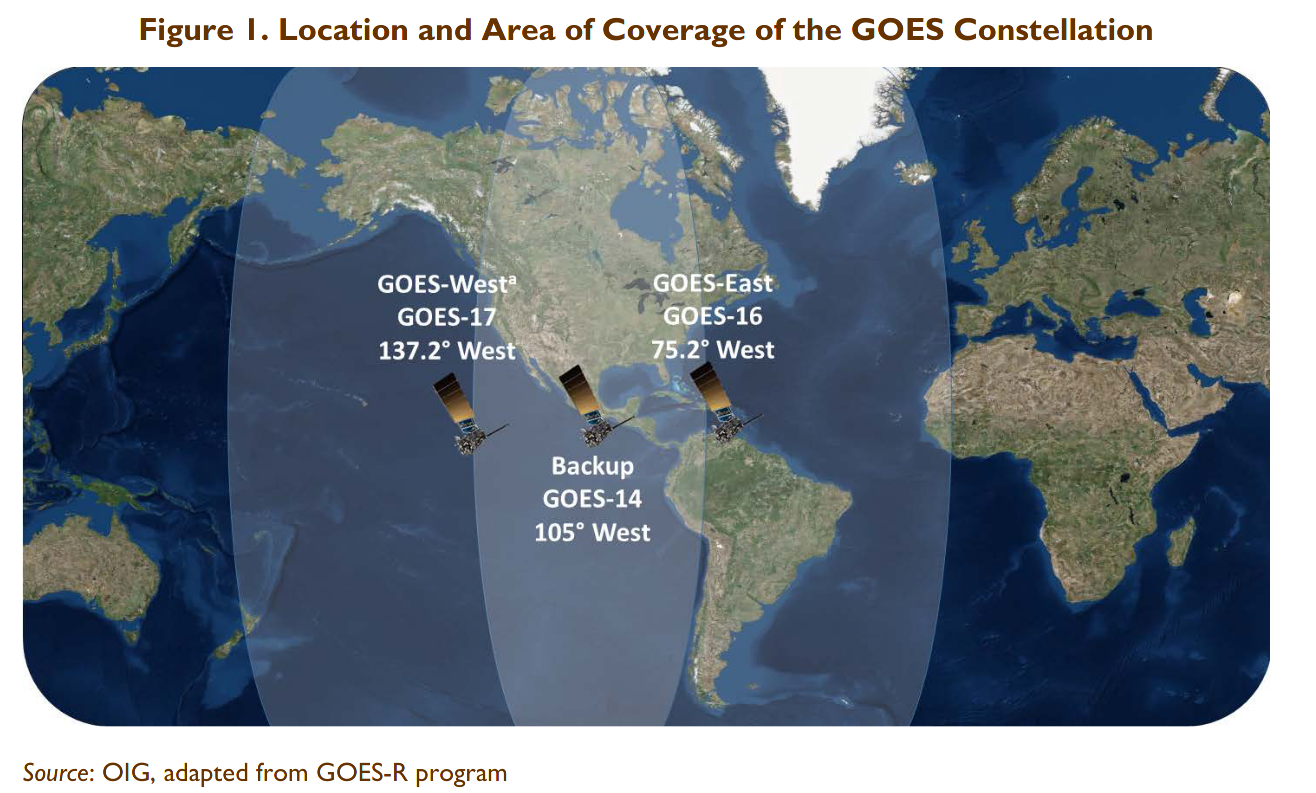
Due to my location (Connecticut, USA), it was logical to pick up HRIT signals from GOES-16.
Software
To decode the incoming HRIT from the satellites, I used SatDump. This program comes with a live decoder with a signal to noise ratio readout, which is handy for fine tuning the antenna. The live decoder reads the received HRIT signal from the SDR, then decodes and outputs images and text from the satellite.
Mounting and Alignment
I mounted the dish crudely on a 5-6 foot EMT conduit pipe, which is easily available in most hardware stores. Then, I roughly pointed the dish to where GOES-16 should be using Gpredict as a guide for the elevation and azimuth location of the satellite. Then, after hooking up the antenna to the LNA then the LNA to the SDR, I started up SatDump’s live decoding utility. This, as mentioned, outputs the signal to noise ratio of the HRIT signal which was handy to fine-align the dish antenna to the satellite. After some alignment, I was able to get a SNR of 4-5 consistently with a clear sky.
Some run later, success
After some experimentation with the setup and software, I felt confident to leave it running from around 13:00 to 21:00 on Thanksgiving day. While some of the images where noisy, I was satisfied for now with the results.
Below are the received images from GOES-16 compiled into a gif loop: